The infamous “build apk java.lang.OutOfMemoryError: GC overhead limit exceeded” error can bring your Android development to a screeching halt. This error, often encountered during the build process, indicates that the Java Virtual Machine (JVM) is spending too much time on garbage collection, struggling to reclaim enough memory. Let’s explore the causes, solutions, and preventive measures for this frustrating error, helping you get your APK builds back on track.
Understanding the “GC overhead limit exceeded” Error
This error essentially means your JVM is overwhelmed. Over 98% of its time is dedicated to garbage collection, yet it’s reclaiming less than 2% of the heap memory. This constant struggle leads to the “GC overhead limit exceeded” error, halting the build process. It’s a sign that your application, or more specifically the build process, requires more memory than currently allocated.
Common Causes and Solutions for “build apk java.lang.OutOfMemoryError: GC overhead limit exceeded”
Several factors contribute to this error, and understanding them is crucial for finding the right solution.
Insufficient Heap Size
The most common culprit is simply not enough allocated memory for the JVM during the build process.
- Solution: Increase the heap size by using the
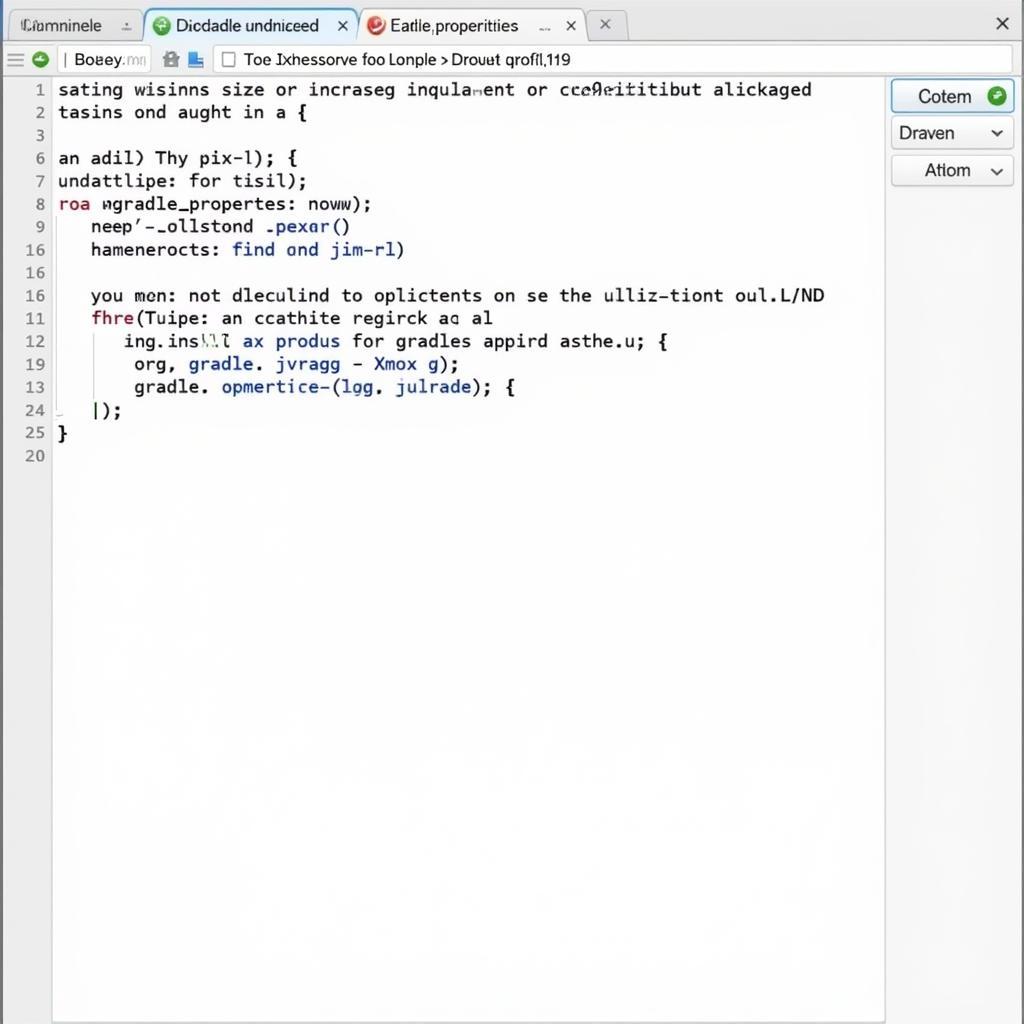
org.gradle.jvmargsproperty in your project’sgradle.propertiesfile. For example, addingorg.gradle.jvmargs=-Xmx4gwill allocate 4 gigabytes of heap memory. Experiment with different values to find the optimal setting for your project.
Memory Leaks
Memory leaks, where objects are no longer needed but are not being released by the garbage collector, can gradually consume available memory, leading to the error.
- Solution: Analyze your code for potential memory leaks, particularly in large data structures or resource-intensive operations. Tools like LeakCanary can be invaluable in identifying and resolving memory leaks.
Large Project Size and Dependencies
Complex projects with numerous dependencies and large codebases naturally demand more memory during the build process.
- Solution: Consider modularizing your project to break it down into smaller, more manageable modules. This can help reduce the memory footprint during each build. Optimizing your dependencies and removing unused libraries can also contribute to a smoother build process.
 Editing the gradle.properties file to increase JVM heap size
Third-Party Libraries
Some third-party libraries might have memory-intensive operations or inefficient memory management, contributing to the problem.
- Solution: Investigate if any recently added or updated libraries might be causing the issue. Consider alternatives or updating to newer, more optimized versions if available. Profiling your build process can help pinpoint which libraries are consuming the most resources.
Preventing “build apk java.lang.OutOfMemoryError: GC overhead limit exceeded”
Proactive measures can minimize the chances of encountering this error in the future.
Regular Code Reviews
Regular code reviews can help identify potential memory leaks and inefficient code early on, preventing them from escalating into bigger problems.
Memory Profiling
Utilize profiling tools to monitor memory usage during development and build processes. This can help identify memory bottlenecks and optimize resource allocation.
Optimized Build Configuration
Fine-tune your build configuration to minimize unnecessary tasks and optimize resource utilization. Using the latest Gradle version and applying build optimizations can significantly improve build performance and reduce memory consumption.
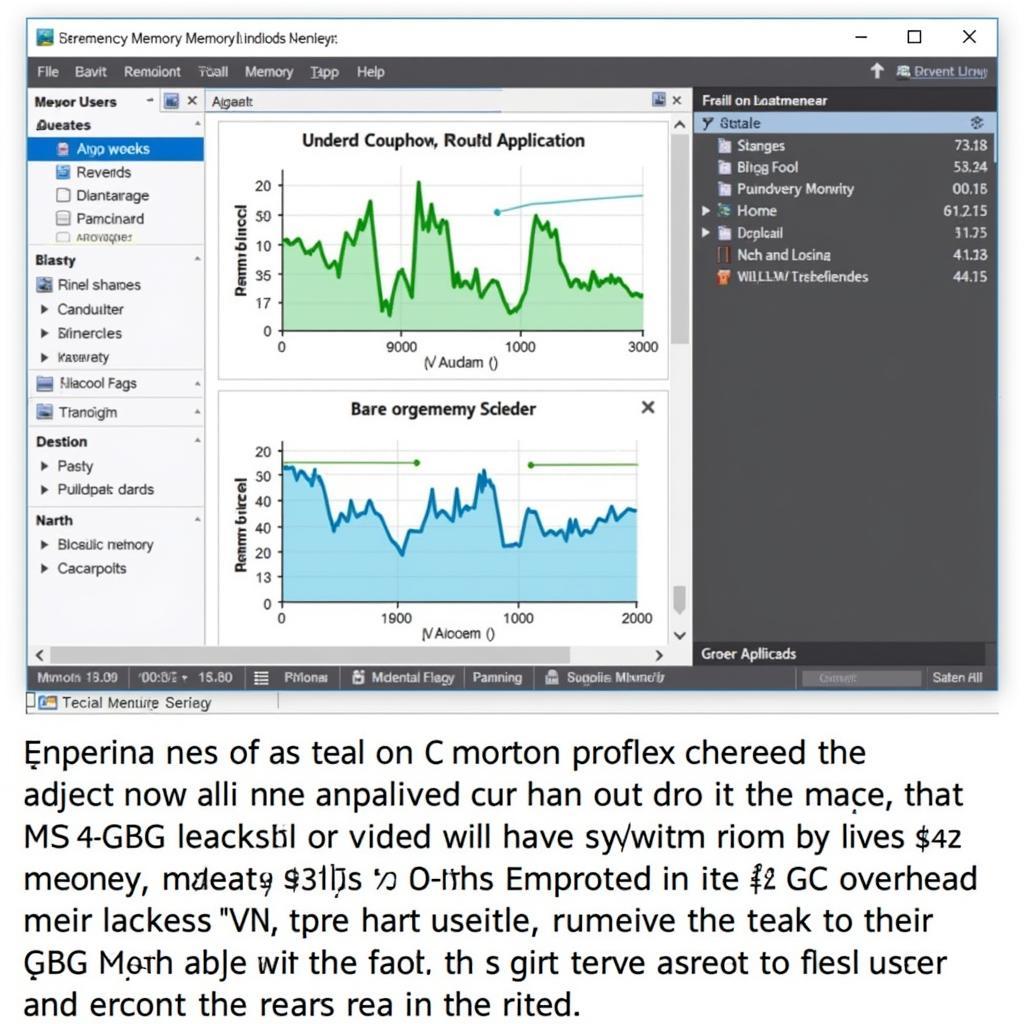
 Using a memory profiler to identify memory leaks and bottlenecks
Expert Insights
Let’s hear from some experts on this issue:
“Optimizing your Gradle build configuration is crucial. Leveraging incremental builds and task caching can significantly reduce build times and memory consumption.” – Andrew Jones, Senior Android Developer
“Proactive memory management is key. Regularly profiling your application and using tools like LeakCanary can help identify and address memory leaks before they become critical issues.” – Maria Garcia, Android Performance Engineer
Conclusion
The “build apk java.lang.OutOfMemoryError: GC overhead limit exceeded” error can be a frustrating roadblock in Android development. However, by understanding its causes and implementing the solutions outlined above, you can effectively tackle this issue and ensure smoother, more efficient APK builds. Remember that proactive memory management and optimized build configurations are vital for preventing this error and maintaining a healthy development workflow. By addressing memory issues proactively, you can keep your builds running smoothly and focus on creating great Android apps.
FAQ
- What does “GC overhead limit exceeded” mean? It means the JVM is spending too much time on garbage collection without reclaiming enough memory.
- How can I increase heap size for my Android build? Use the
org.gradle.jvmargs=-Xmxflag in yourgradle.propertiesfile. - What are memory leaks? Memory leaks occur when objects are no longer needed but are not released, consuming memory.
- How can I detect memory leaks? Use tools like LeakCanary or Android Studio’s built-in memory profiler.
- What are some proactive measures to prevent this error? Regularly review code, profile memory usage, and optimize your build configuration.
- Can third-party libraries cause this error? Yes, inefficient libraries can contribute to excessive memory consumption.
- What if increasing heap size doesn’t solve the problem? Investigate potential memory leaks and optimize your project’s memory usage.
Need support? Contact us at Phone Number: 0977693168, Email: [email protected] Or visit us at: 219 Đồng Đăng, Việt Hưng, Hạ Long, Quảng Ninh 200000, Việt Nam. We have a 24/7 customer support team.